
Practice Test #2
Simulate the real exam experience with 50 questions and a 100-minute time limit. Practice with AI-verified answers and detailed explanations.
AI-Powered
Triple AI-Verified Answers & Explanations
GPT Pro, Claude Opus, and Gemini Pro cross-check every answer and explanation. See the reasoning for each option, requirement breakdowns, and solution architectures.
Practice Questions
HOTSPOT - You have a Power BI model that contains a table named Sales and a related date table. Sales contains a measure named Total Sales. You need to create a measure that calculates the total sales from the equivalent month of the previous year. How should you complete the calculation? To answer, select the appropriate options in the answer area. NOTE: Each correct selection is worth one point. Hot Area:
Sales Previous Year = ______
[Total Sales], ______(
Note: This question is part of a series of questions that present the same scenario. Each question in the series contains a unique solution that might meet the stated goals. Some question sets might have more than one correct solution, while others might not have a correct solution. After you answer a question in this section, you will NOT be able to return to it. As a result, these questions will not appear in the review screen. You are modeling data by using Microsoft Power BI. Part of the data model is a large Microsoft SQL Server table named Order that has more than 100 million records. During the development process, you need to import a sample of the data from the Order table. Solution: From Power Query Editor, you import the table and then add a filter step to the query. Does this meet the goal?
DRAG DROP - You are using existing reports to build a dashboard that will be viewed frequently in portrait mode on mobile phones. You need to build the dashboard. Which four actions should you perform in sequence? To answer, move the appropriate actions from the list of actions to the answer area and arrange them in the correct order. Select and Place:
Pin items from the reports to the dashboard.
Open the dashboard.
Create a phone layout for the existing reports.
Edit the Dashboard mobile view.
Rearrange, resize, or remove items from the mobile layout.
You have an Azure SQL database that contains sales transactions. The database is updated frequently. You need to generate reports from the data to detect fraudulent transactions. The data must be visible within five minutes of an update. How should you configure the data connection?
In Power BI Desktop, you are creating visualizations in a report based on an imported dataset. You need to allow Power BI users to export the summarized data used to create the visualizations but prevent the users from exporting the underlying data. What should you do?
Keep your exam routine moving
Get timed mock exams, AI explanations, focused review, and learning insights.
You build a report to analyze customer transactions from a database that contains the tables shown in the following table. Table name Column name Customer CustomerID (primary key) Name State Email Transaction TransactionID (primary key) CustomerID (foreign key) Date Amount You import the tables. Which relationship should you use to link the tables?
You are creating a sales report in Power BI for the NorthWest region sales territory of your company. Data will come from a view in a Microsoft SQL Server database. A sample of the data is shown in the following table: ID ProductKey OrderDate ShipDate CustomerKey SalesTerritoryRegion SalesOrderNumber SalesOrderLineNumber OrderQuantity UnitPrice SalesAmount TaxAmount Freight 1 310 2010-12-29 2011-01-05 21768 Canada SO43697 1 1 3578.27 3578.27 286.2616 89.4568 2 346 2010-12-29 2011-01-05 27365 France SO43698 1 1 3399.99 3399.99 271.9992 84.9998 3 346 2010-12-29 2011-01-05 76537 NorthWest SO43699 1 1 3399.99 3399.99 271.9992 84.9998 4 336 2010-12-30 2011-01-06 34256 SouthWest SO43700 1 1 699.0992 699.0982 55.9279 17.4775 5 346 2010-12-30 2011-01-06 34253 Australia SO43701 1 1 3399.99 3399.99 271.9992 84.9998 6 311 2010-12-30 2011-01-06 12543 SouthWest SO43702 1 1 3578.27 3578.27 286.2616 89.4568 7 310 2010-12-30 2011-01-06 76545 Australia SO43703 1 1 3578.27 3578.27 286.2616 89.4568 The report will facilitate the following analysis: ✑ The count of orders and the sum of total sales by Order Date ✑ The count of customers who placed an order ✑ The average quantity per order You need to reduce data refresh times and report query times. Which two actions should you perform? Each correct answer presents part of the solution. NOTE: Each correct selection is worth one point.
DRAG DROP -
Once the profit and loss dataset is created, which four actions should you perform in sequence to ensure that the business unit analysts see the appropriate profit and loss data? To answer, move the appropriate actions from the list of actions to the answer area and arrange them in the correct order. Select and Place:
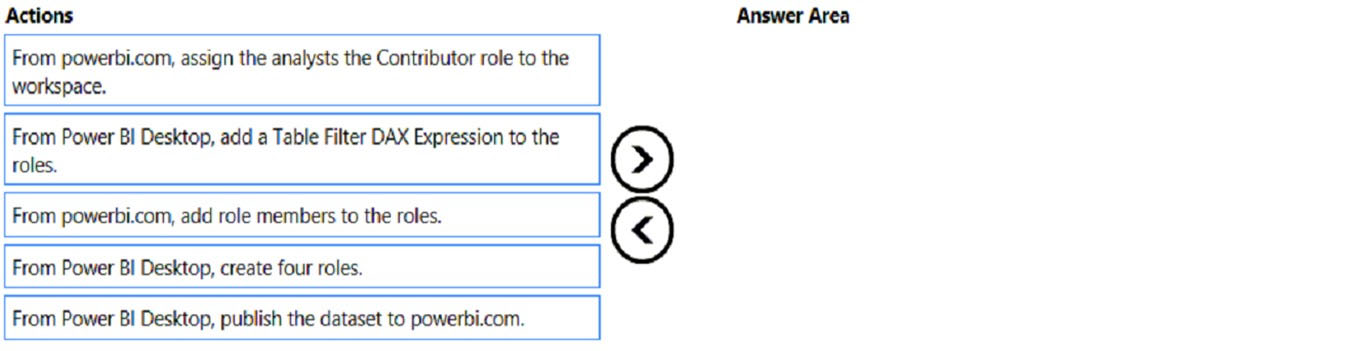
Which sequence ensures business unit analysts see only the appropriate profit and loss data?
HOTSPOT - You need to design the data model and the relationships for the Customer Details worksheet and the Orders table by using Power BI. The solution must meet the report requirements. For each of the following statements, select Yes if the statement is true. Otherwise, select No. NOTE: Each correct selection is worth one point. Hot Area:
A relationship must be created between the CustomerID column in the Customer Details worksheet and the CustomerID column in the Orders table.
The Data Type of the columns in the relationship between the Customer Details worksheet and the Orders table must be set to Text.
The Region field used to filter the Top Customers report must come from the Orders table.
You have a Power BI report hosted on powerbi.com that displays expenses by department for department managers. The report contains a line chart that shows expenses by month. You need to enable users to choose between viewing the report as a line chart or a column chart. The solution must minimize development and maintenance effort. What should you do?

Start Practicing Now
Download Cloud Pass and start practicing all PL-300: Microsoft Power BI Data Analyst exam questions.