
Practice Test #1
50개 문제와 100분 시간 제한으로 실제 시험을 시뮬레이션하세요. AI 검증 답안과 상세 해설로 학습하세요.
AI 기반
3중 AI 검증 답안 및 해설
GPT Pro, Claude Opus, Gemini Pro가 답안과 해설을 교차 검증합니다. 선택지별 근거부터 요구사항 분해와 정답 아키텍처까지 확인하세요.
실전형 문제
You have a Microsoft SharePoint Online site that contains several document libraries. One of the document libraries contains manufacturing reports saved as Microsoft Excel files. All the manufacturing reports have the same data structure. You need to use Power BI Desktop to load only the manufacturing reports to a table for analysis. What should you do?
DRAG DROP -
Sheet1과 Sheet2가 있는 Microsoft Excel 통합 문서가 있습니다. Sheet1에는 Table1, Sheet2에는 Table2가 있으며 두 테이블 모두 Products 열을 포함합니다. 두 테이블의 제품 값을 하나의 중복 없는 목록으로 만들어 Power BI에서 사용해야 합니다.
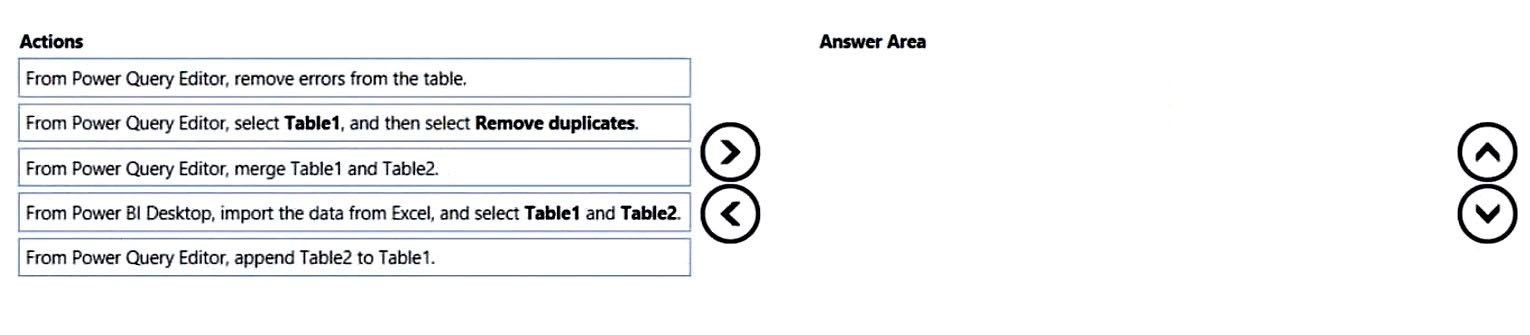
Table1과 Table2에서 중복 없는 하나의 Products 목록을 만들려면 어떤 순서가 올바른가요?
You have a project management app that is fully hosted in Microsoft Teams. The app was developed by using Microsoft Power Apps. You need to create a Power BI report that connects to the project management app. Which connector should you select?
HOTSPOT - You are creating a Microsoft Power BI imported data model to perform basket analysis. The goal of the analysis is to identify which products are usually bought together in the same transaction across and within sales territories. You import a fact table named Sales as shown in the exhibit. (Click the Exhibit tab.) SalesRowID | ProductKey | OrderDateKey | OrderDate | CustomerKey | SalesTerritoryKey | SalesOrderNumber | SalesOrderLineNumber | OrderQuantity | LineTotal | TaxAmt | Freight | LastModified | AuditID 1 | 310 | 20101229 | 2010-12-29 00:00:00.000 | 21768 | 6 | SO43697 | 1 | 1 | 3578.27 | 286.2616 | 89.4568 | 2011-01-10 00:00:00.000 | 127 2 | 346 | 20101229 | 2010-12-29 00:00:00.000 | 28389 | 7 | SO43698 | 1 | 1 | 3399.99 | 271.9992 | 84.9998 | 2011-01-10 00:00:00.000 | 127 3 | 346 | 20101229 | 2010-12-29 00:00:00.000 | 25863 | 1 | SO43699 | 1 | 1 | 3399.99 | 271.9992 | 84.9992 | 2011-01-10 00:00:00.000 | 127 4 | 336 | 20101229 | 2010-12-29 00:00:00.000 | 14501 | 4 | SO43700 | 1 | 1 | 699.0982 | 55.9279 | 17.4775 | 2011-01-10 00:00:00.000 | 127 5 | 346 | 20101229 | 2010-12-29 00:00:00.000 | 11003 | 9 | SO43701 | 1 | 1 | 3399.99 | 271.9992 | 84.9998 | 2011-01-10 00:00:00.000 | 127 6 | 311 | 20101230 | 2010-12-30 00:00:00.000 | 27645 | 4 | SO43702 | 1 | 1 | 3578.27 | 286.2616 | 89.4568 | 2011-01-11 00:00:00.000 | 127 7 | 310 | 20101230 | 2010-12-30 00:00:00.000 | 16624 | 9 | SO43703 | 1 | 1 | 3578.27 | 286.2616 | 89.4568 | 2011-01-11 00:00:00.000 | 127 The related dimension tables are imported into the model. Sales contains the data shown in the following table. Column name Data type Description SalesRowID Integer ID of the row from the source system, which represents a unique combination of SalesOrderNumber and SalesOrderLineNumber ProductKey Integer Surrogate key that relates to the product dimension OrderDateKey Integer Surrogate key that relates to the date dimension and is in the YYYYMMDD format OrderDate Datetime Date and time an order was processed CustomerKey Integer Surrogate key that relates to the customer dimension SalesTerritoryKey Integer Surrogate key that relates to the sales territory dimension SalesOrderNumber Text Unique identifier of an order SalesOrderLineNumber Integer Unique identifier of a line within an order OrderQuantity Integer Quantity of the product ordered LineTotal Decimal Total sales amount of a line before tax TaxAmt Decimal Amount of tax charged for the items on a specified line within an order Freight Decimal Amount of freight charged for the items on a specified line within an order LastModified Datetime The date and time that a row was last modified in the source system AuditID Integer The ID of the data load process that last updated a row You are evaluating how to optimize the model. For each of the following statements, select Yes if the statement is true. Otherwise, select No. NOTE: Each correct selection is worth one point. Hot Area:
The SalesRowID and AuditID columns can be removed from the model without impeding the analysis goals.
Both the OrderDateKey and OrderDate columns are necessary to perform the basket analysis.
The TaxAmt column must retain the current number of decimal places to perform the basket analysis.
You have a collection of reports for the HR department of your company. The datasets use row-level security (RLS). The company has multiple sales regions. Each sales region has an HR manager. You need to ensure that the HR managers can interact with the data from their region only. The HR managers must be prevented from changing the layout of the reports. How should you provision access to the reports for the HR managers?
합격 루틴을 앱에서 이어가세요
실전 모의고사, AI 해설, 약점 회독과 학습 분석을 모두 제공합니다.
DRAG DROP -
100개의 CSV 파일이 들어 있는 folder가 있습니다. Power BI를 사용해 파일 metadata를 하나의 dataset으로 사용할 수 있어야 합니다. 단, CSV 파일의 실제 데이터는 저장하면 안 됩니다.
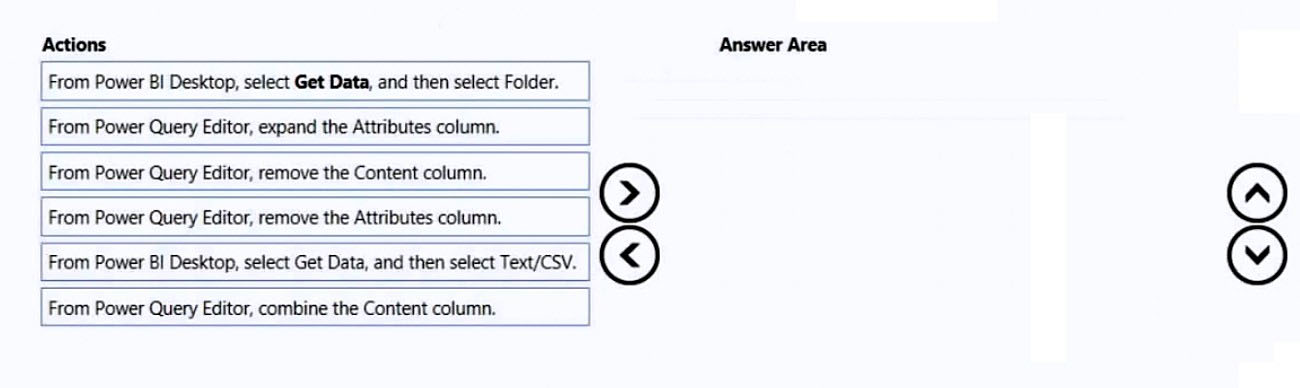
CSV 파일 내용은 저장하지 않고 파일 metadata만 dataset으로 사용하려면 어떤 순서가 올바른가요?
HOTSPOT - You have a column named UnitsInStock as shown in the following exhibit.
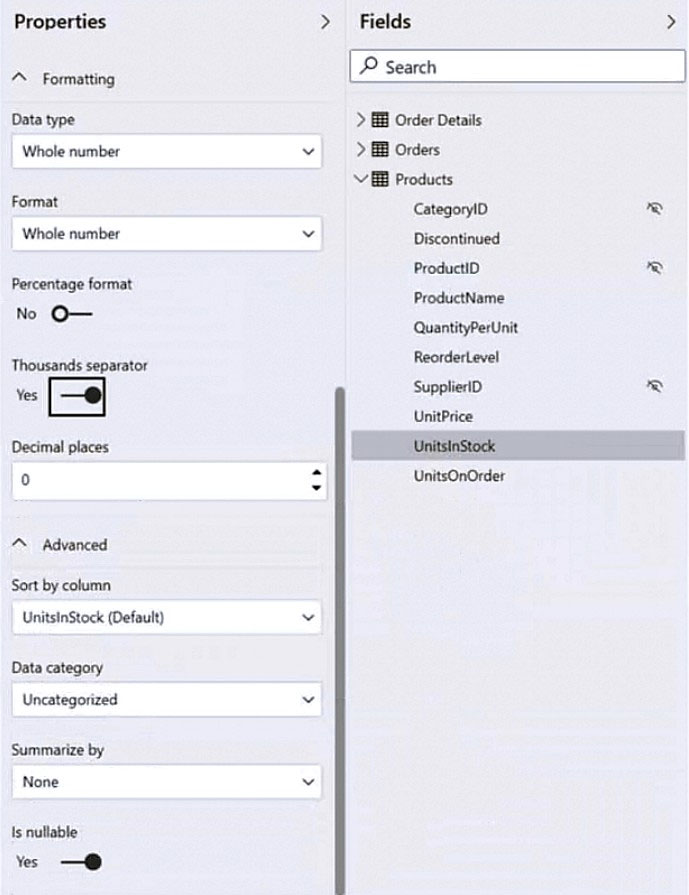
UnitsInStock has 75 non-null values, of which 51 are unique. Use the drop-down menus to select the answer choice that completes each statement based on the information presented in the graphic. NOTE: Each correct selection is worth one point. Hot Area:
When a table visual is created in a report and UnitsInStock is added to the values, there will be ______ in the table.
Changing the Summarize by setting of the UnitsInStock column, and then adding the column to a table visual, will ______ the number of rows in the table visual.
You have a Power BI report for the marketing department. The report reports on web traffic to a blog and contains data from the following tables. Table name Source Description Column name Posts Blog RSS feed An XML representation of all the blog posts from • Publish Date your company’s website • URL • Title • Full Text • Summary Traffic Website logs Activity data from your company’s entire website • DateTime • URL Visited • IP Address • Browser Agent • Referring URL There is a one-to-many relationship from Posts to Traffic that uses the URL and URL Visited columns. The report contains the visuals shown in the following table.
The dataset takes a long time to refresh. You need to modify Posts and Traffic queries to reduce load times. Which two actions will reduce the load times? Each correct answer presents part of the solution. NOTE: Each correct selection is worth one point.
Top 10 blog posts of all time uses Posts[Title] and Traffic[DateTime] with no filter.
Top 10 blog posts from the last seven days uses Posts[Title] and Traffic[DateTime] with Traffic[DateTime] is in the last 7 days filter.
Blog visits over time uses Traffic[DateTime] and Traffic[URL Visited] with Traffic[URL Visited] contains 'blog' filter.
Top 10 external referrals to the blog of all time uses Traffic[Referring URL] with Traffic[URL Visited] contains 'blog' and Traffic[Referring URL] does not start with '/' filter.
You have the visual shown in the exhibit. (Click the Exhibit tab.)
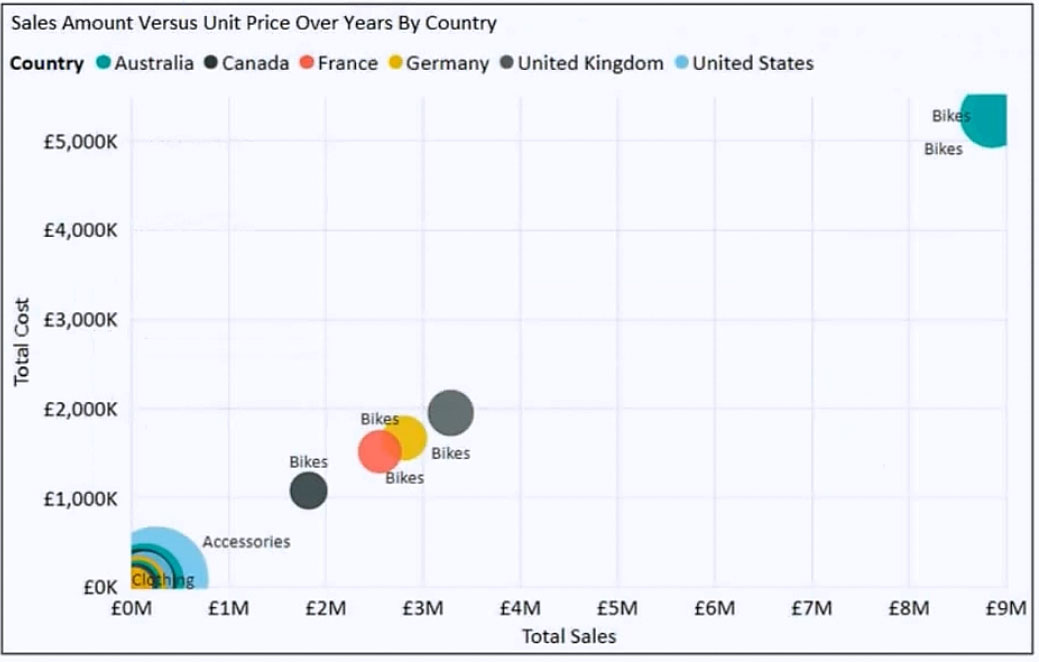
You need to show the relationship between Total Cost and Total Sales over time. What should you do?
HOTSPOT - You are creating a line chart in a Power BI report as shown in the following exhibit.
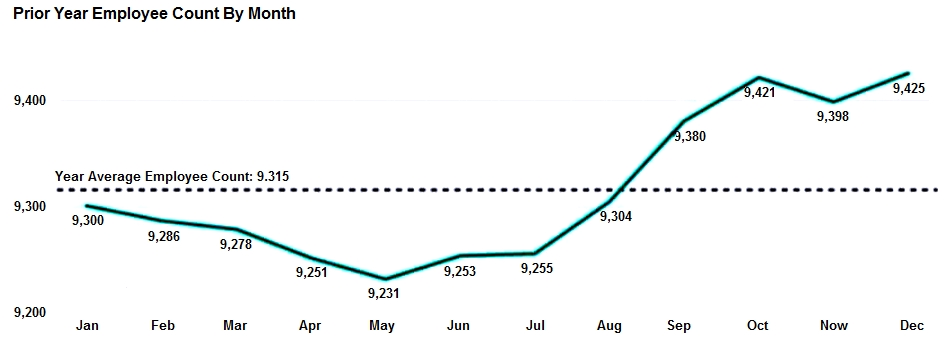
Use the drop-down menus to select the answer choice that completes each statement based on the information presented in the graphic. NOTE: Each correct selection is worth one point. Hot Area:
The dashed line representing the Year Average Employee Count was created by using ______.
To enable users to drill down to weeks or days, add the Weeks and Days field to the ______ bucket.

지금 학습 시작하기
Cloud Pass를 다운로드하고 PL-300: Microsoft Power BI Data Analyst 자격증 학습을 이어가세요.