Prepare the Data출제율 27%

시험 준비 허브
PL-300: Microsoft Power BI Data Analyst
Microsoft 자격증 시험을 준비하세요. 실전형 문제를 먼저 풀어보고, 시험 도메인과 모의고사 구성까지 확인할 수 있습니다.
무료 문제 체험
문제를 직접 풀고 해설 품질을 확인하세요
정답을 고른 뒤 선택지별 근거, 핵심 학습 포인트와 관련 서비스를 바로 확인할 수 있습니다.
1
문제 1
You have a Microsoft SharePoint Online site that contains several document libraries. One of the document libraries contains manufacturing reports saved as Microsoft Excel files. All the manufacturing reports have the same data structure. You need to use Power BI Desktop to load only the manufacturing reports to a table for analysis. What should you do?
2
문제 2
DRAG DROP -
Sheet1과 Sheet2가 있는 Microsoft Excel 통합 문서가 있습니다. Sheet1에는 Table1, Sheet2에는 Table2가 있으며 두 테이블 모두 Products 열을 포함합니다. 두 테이블의 제품 값을 하나의 중복 없는 목록으로 만들어 Power BI에서 사용해야 합니다.
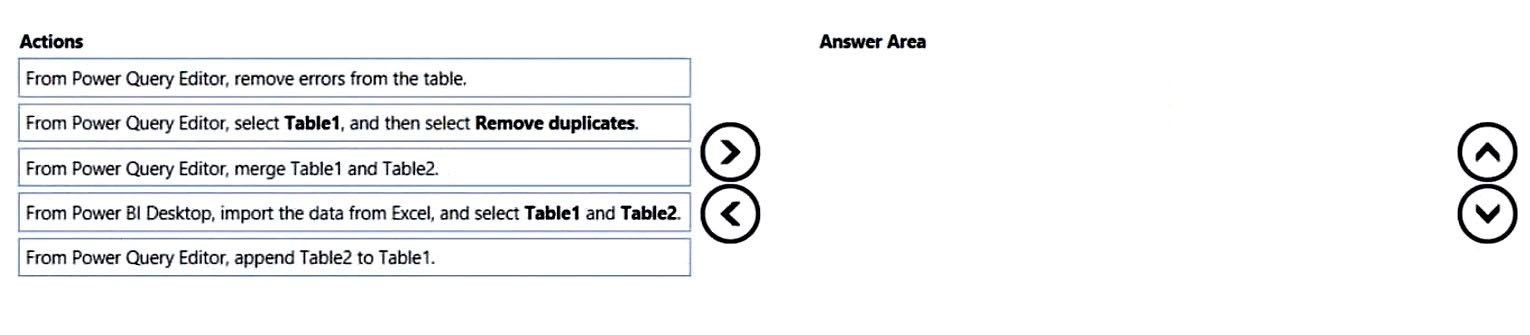
파트 1:
Table1과 Table2에서 중복 없는 하나의 Products 목록을 만들려면 어떤 순서가 올바른가요?
3
문제 3
You are creating a report in Power BI Desktop. You load a data extract that includes a free text field named coll. You need to analyze the frequency distribution of the string lengths in col1. The solution must not affect the size of the model. What should you do?
4
문제 4
HOTSPOT - You have a Power BI model that contains a table named Sales and a related date table. Sales contains a measure named Total Sales. You need to create a measure that calculates the total sales from the equivalent month of the previous year. How should you complete the calculation? To answer, select the appropriate options in the answer area. NOTE: Each correct selection is worth one point. Hot Area:
파트 1:
Sales Previous Year = ______
파트 2:
[Total Sales], ______(
파트 3:
5
문제 5
You have a Microsoft Power BI data model that contains three tables named Orders, Date, and City. There is a one-to-many relationship between Date and Orders and between City and Orders. The model contains two row-level security (RLS) roles named Role1 and Role2. Role1 contains the following filter. City[State Province] = "Kentucky" Role2 contains the following filter.
Date[Calendar Year] = 2020 - If a user is a member of both Role1 and Role2, what data will they see in a report that uses the model?
합격 루틴을 앱에서 이어가세요
실전 모의고사, AI 해설, 약점 회독과 학습 분석을 모두 제공합니다.
6
문제 6
You have a project management app that is fully hosted in Microsoft Teams. The app was developed by using Microsoft Power Apps. You need to create a Power BI report that connects to the project management app. Which connector should you select?
7
문제 7
You import a Power BI dataset that contains the following tables: ✑ Date ✑ Product ✑ Product Inventory The Product Inventory table contains 25 million rows. A sample of the data is shown in the following table. ProductKey DateKey MovementDate UnitCost UnitsIn UnitsOut UnitsBalance 167 20101228 28-Dec-10 0.19 0 0 875 167 20101229 29-Dec-10 0.19 0 0 875 167 20110119 19-Jan-11 0.19 0 0 875 167 20110121 21-Jan-11 0.19 0 0 875 167 20110122 22-Jan-11 0.19 0 0 875 The Product Inventory table relates to the Date table by using the DateKey column. The Product Inventory table relates to the Product table by using the ProductKey column. You need to reduce the size of the data model without losing information. What should you do?
8
문제 8
HOTSPOT - You plan to create the Power BI model shown in the exhibit. (Click the Exhibit tab.)
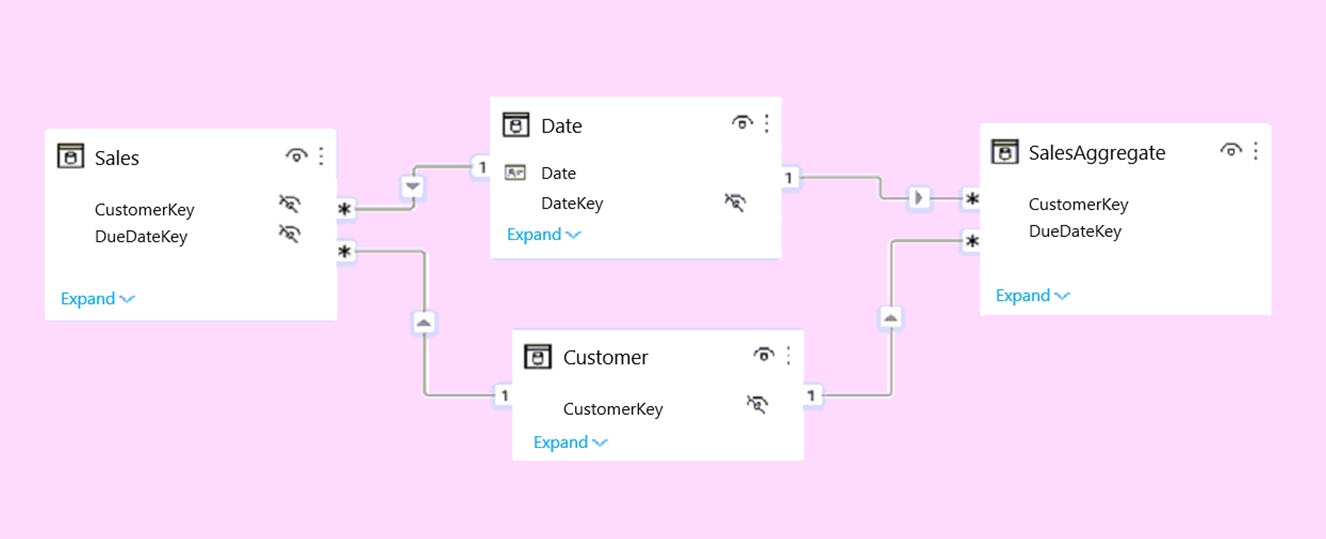
The data has the following refresh requirements: ✑ Customer must be refreshed daily. ✑ Date must be refreshed once every three years. ✑ Sales must be refreshed in near real time. ✑ SalesAggregate must be refreshed once per week. You need to select the storage modes for the tables. The solution must meet the following requirements: ✑ Minimize the load times of visuals. ✑ Ensure that the data is loaded to the model based on the refresh requirements. Which storage mode should you select for each table? To answer, select the appropriate options in the answer area. NOTE: Each correct selection is worth one point. Hot Area:
파트 1:
Customer: ______
파트 2:
Date: ______
파트 3:
Sales: ______
파트 4:
SalesAggregate: ______
9
문제 9
DRAG DROP -
여러 지역의 최근 1년 판매 데이터를 표시하는 보고서를 만들 계획입니다. 지역별로 데이터 행 접근을 제한하기 위해 row-level security(RLS)를 사용해야 합니다. 어떤 작업 순서가 올바른가요?
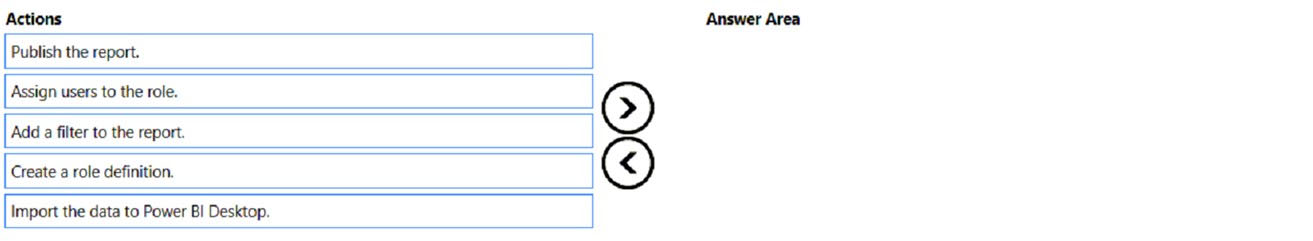
파트 1:
지역별 판매 데이터에 row-level security(RLS)를 구성하려면 어떤 순서가 올바른가요?
10
문제 10
You have a Microsoft Power BI report. The size of PBIX file is 550 MB. The report is accessed by using an App workspace in shared capacity of powerbi.com. The report uses an imported dataset that contains one fact table. The fact table contains 12 million rows. The dataset is scheduled to refresh twice a day at 08:00 and 17:00. The report is a single page that contains 15 AppSource visuals and 10 default visuals. Users say that the report is slow to load the visuals when they access and interact with the report. You need to recommend a solution to improve the performance of the report. What should you recommend?
11
문제 11
HOTSPOT - You are creating a Microsoft Power BI imported data model to perform basket analysis. The goal of the analysis is to identify which products are usually bought together in the same transaction across and within sales territories. You import a fact table named Sales as shown in the exhibit. (Click the Exhibit tab.) SalesRowID | ProductKey | OrderDateKey | OrderDate | CustomerKey | SalesTerritoryKey | SalesOrderNumber | SalesOrderLineNumber | OrderQuantity | LineTotal | TaxAmt | Freight | LastModified | AuditID 1 | 310 | 20101229 | 2010-12-29 00:00:00.000 | 21768 | 6 | SO43697 | 1 | 1 | 3578.27 | 286.2616 | 89.4568 | 2011-01-10 00:00:00.000 | 127 2 | 346 | 20101229 | 2010-12-29 00:00:00.000 | 28389 | 7 | SO43698 | 1 | 1 | 3399.99 | 271.9992 | 84.9998 | 2011-01-10 00:00:00.000 | 127 3 | 346 | 20101229 | 2010-12-29 00:00:00.000 | 25863 | 1 | SO43699 | 1 | 1 | 3399.99 | 271.9992 | 84.9992 | 2011-01-10 00:00:00.000 | 127 4 | 336 | 20101229 | 2010-12-29 00:00:00.000 | 14501 | 4 | SO43700 | 1 | 1 | 699.0982 | 55.9279 | 17.4775 | 2011-01-10 00:00:00.000 | 127 5 | 346 | 20101229 | 2010-12-29 00:00:00.000 | 11003 | 9 | SO43701 | 1 | 1 | 3399.99 | 271.9992 | 84.9998 | 2011-01-10 00:00:00.000 | 127 6 | 311 | 20101230 | 2010-12-30 00:00:00.000 | 27645 | 4 | SO43702 | 1 | 1 | 3578.27 | 286.2616 | 89.4568 | 2011-01-11 00:00:00.000 | 127 7 | 310 | 20101230 | 2010-12-30 00:00:00.000 | 16624 | 9 | SO43703 | 1 | 1 | 3578.27 | 286.2616 | 89.4568 | 2011-01-11 00:00:00.000 | 127 The related dimension tables are imported into the model. Sales contains the data shown in the following table. Column name Data type Description SalesRowID Integer ID of the row from the source system, which represents a unique combination of SalesOrderNumber and SalesOrderLineNumber ProductKey Integer Surrogate key that relates to the product dimension OrderDateKey Integer Surrogate key that relates to the date dimension and is in the YYYYMMDD format OrderDate Datetime Date and time an order was processed CustomerKey Integer Surrogate key that relates to the customer dimension SalesTerritoryKey Integer Surrogate key that relates to the sales territory dimension SalesOrderNumber Text Unique identifier of an order SalesOrderLineNumber Integer Unique identifier of a line within an order OrderQuantity Integer Quantity of the product ordered LineTotal Decimal Total sales amount of a line before tax TaxAmt Decimal Amount of tax charged for the items on a specified line within an order Freight Decimal Amount of freight charged for the items on a specified line within an order LastModified Datetime The date and time that a row was last modified in the source system AuditID Integer The ID of the data load process that last updated a row You are evaluating how to optimize the model. For each of the following statements, select Yes if the statement is true. Otherwise, select No. NOTE: Each correct selection is worth one point. Hot Area:
파트 1:
The SalesRowID and AuditID columns can be removed from the model without impeding the analysis goals.
파트 2:
Both the OrderDateKey and OrderDate columns are necessary to perform the basket analysis.
파트 3:
The TaxAmt column must retain the current number of decimal places to perform the basket analysis.
12
문제 12
Note: This question is part of a series of questions that present the same scenario. Each question in the series contains a unique solution that might meet the stated goals. Some question sets might have more than one correct solution, while others might not have a correct solution. After you answer a question in this section, you will NOT be able to return to it. As a result, these questions will not appear in the review screen. You are modeling data by using Microsoft Power BI. Part of the data model is a large Microsoft SQL Server table named Order that has more than 100 million records. During the development process, you need to import a sample of the data from the Order table. Solution: From Power Query Editor, you import the table and then add a filter step to the query. Does this meet the goal?
13
문제 13
Note: This question is part of a series of questions that present the same scenario. Each question in the series contains a unique solution that might meet the stated goals. Some question sets might have more than one correct solution, while others might not have a correct solution. After you answer a question in this section, you will NOT be able to return to it. As a result, these questions will not appear in the review screen. You are modeling data by using Microsoft Power BI. Part of the data model is a large Microsoft SQL Server table named Order that has more than 100 million records. During the development process, you need to import a sample of the data from the Order table. Solution: You write a DAX expression that uses the FILTER function. Does this meet the goal?
14
문제 14
HOTSPOT - You have a Power BI report. You have the following tables. Name Description Balances The table contains daily records of closing balances for every active bank account. The closing balances appear for every day the account is live, including the last day. Date The table contains a record per day for the calendar years of 2000 to 2025. There is a hierarchy for financial year, quarter, month, and day. You have the following DAX measure. Accounts := CALCULATE ( DISTINCTCOUNT (Balances[AccountID]), LASTDATE ('Date'[Date]) For each of the following statements, select Yes if the statement is true. Otherwise, select No. NOTE: Each correct selection is worth one point. Hot Area:
파트 1:
A table visual that displays the date hierarchy at the year level and the [Accounts] measure will show the total number of accounts that were live throughout the year.
파트 2:
A table visual that displays the date hierarchy at the month level and the [Accounts] measure will show the total number of accounts that were live throughout the month.
파트 3:
A table visual that displays the date hierarchy at the day level and the [Accounts] measure will show the total number of accounts that were live that day.
15
문제 15
(2개 선택)You have a report that contains four pages. Each page contains slicers for the same four fields. Users report that when they select values in a slicer on one page, the selections are not persisted on other pages. You need to recommend a solution to ensure that users can select a value once to filter the results on all the pages. What are two possible recommendations to achieve this goal? Each correct answer presents a complete solution. NOTE: Each correct selection is worth one point.
16
문제 16
DRAG DROP - You are using existing reports to build a dashboard that will be viewed frequently in portrait mode on mobile phones. You need to build the dashboard. Which four actions should you perform in sequence? To answer, move the appropriate actions from the list of actions to the answer area and arrange them in the correct order. Select and Place:
파트 1:
Pin items from the reports to the dashboard.
파트 2:
Open the dashboard.
파트 3:
Create a phone layout for the existing reports.
파트 4:
Edit the Dashboard mobile view.
파트 5:
Rearrange, resize, or remove items from the mobile layout.
17
문제 17
You have a Power BI report. The report contains a visual that shows gross sales by date. The visual has anomaly detection enabled. No anomalies are detected. You need to increase the likelihood that anomaly detection will identify anomalies in the report. What should you do?
18
문제 18
(2개 선택)You have a Power BI query named Sales that imports the columns shown in the following table.
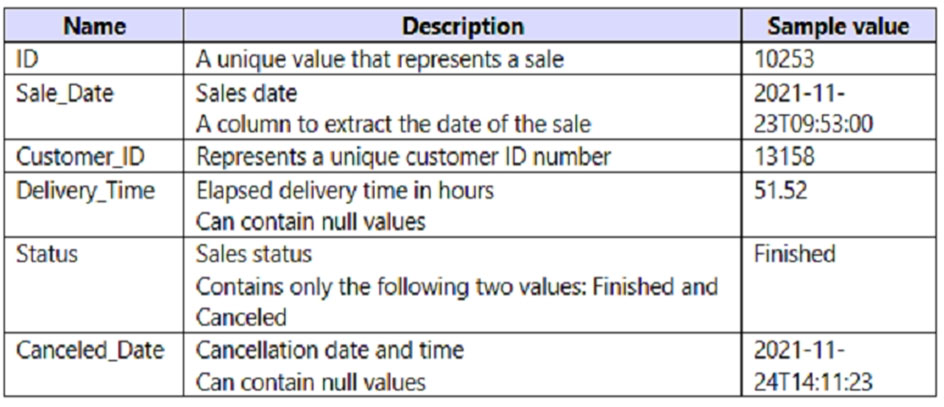
Users only use the date part of the Sales_Date field. Only rows with a Status of Finished are used in analysis. You need to reduce the load times of the query without affecting the analysis. Which two actions achieve this goal? Each correct answer presents a complete solution. NOTE: Each correct selection is worth one point.
19
문제 19
For the sales department at your company, you publish a Power BI report that imports data from a Microsoft Excel file located in a Microsoft SharePoint folder. The data model contains several measures. You need to create a Power BI report from the existing data. The solution must minimize development effort. Which type of data source should you use?
20
문제 20
DRAG DROP -
Microsoft Excel 원본의 수익 데이터를 Power Query에서 미리 보고 있습니다. 보고서에서 사용하기 쉽도록 부서, 제품, 연도, 수익이 각각 열로 표현되는 정규화된 테이블로 변환해야 합니다.
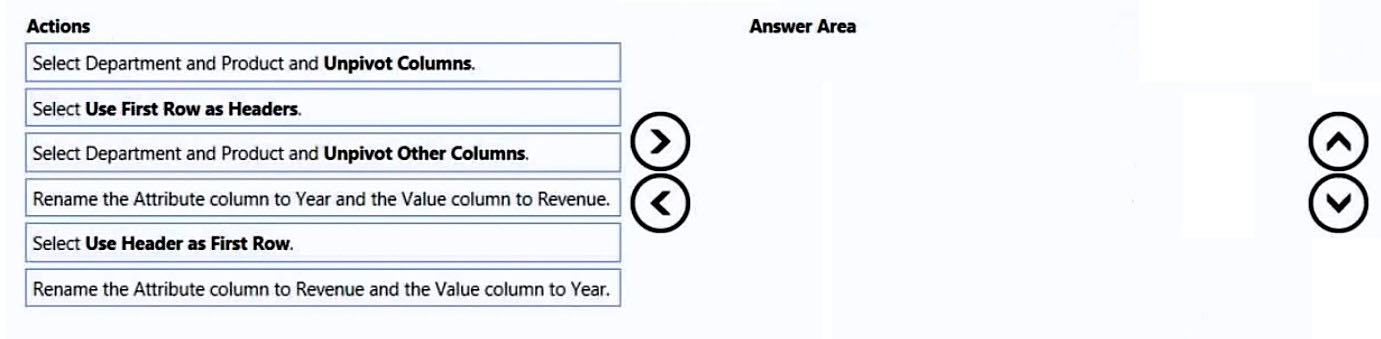
파트 1:
Department, Product, Year, Revenue 열을 가진 긴 형태의 수익 테이블을 만들려면 어떤 Power Query 변환 순서가 올바른가요?
시험 도메인
출제 비중을 기준으로 먼저 학습할 영역을 정하세요.
Model the Data출제율 27%
Visualize and Analyze the Data출제율 28%
Manage and Secure Power BI출제율 18%
다른 Microsoft 자격증


지금 학습 시작하기
Cloud Pass를 다운로드하여 PL-300: Microsoft Power BI Data Analyst 전체 학습을 이어가세요.