
CloudPass LogoCloud Pass
AWSGoogle CloudMicrosoftCiscoCompTIADatabricks
Certifications
AWSGoogle CloudMicrosoftCiscoCompTIADatabricks
PL-300: Microsoft Power BI Data Analyst

Practice Test #4

50개 문제와 100분 시간 제한으로 실제 시험을 시뮬레이션하세요. AI 검증 답안과 상세 해설로 학습하세요.

50문제100분700/1000합격 점수
기출 문제 보기

AI 기반

3중 AI 검증 답안 및 해설

모든 답안은 3개의 최고 AI 모델로 교차 검증하여 최고의 정확도를 보장합니다. 선택지별 상세 해설과 심층 문제 분석을 제공합니다.

GPT Pro
Claude Opus
Gemini Pro
선택지별 상세 해설
심층 문제 분석
3개 모델 합의 정확도

기출 문제

1
문제 1

DRAG DROP -

여러 지역의 최근 1년 판매 데이터를 표시하는 보고서를 만들 계획입니다. 지역별로 데이터 행 접근을 제한하기 위해 row-level security(RLS)를 사용해야 합니다. 어떤 작업 순서가 올바른가요?

question-image

파트 1:

지역별 판매 데이터에 row-level security(RLS)를 구성하려면 어떤 순서가 올바른가요?

RLS는 Power BI 모델에 정의되므로 먼저 Power BI Desktop에서 데이터를 가져와 모델을 만들고 role과 DAX filter를 구성해야 합니다. 게시 후에는 Power BI service에서 해당 role에 사용자나 그룹을 할당합니다. Slicer나 dashboard filter, 지역별 별도 보고서는 사용자별 행 단위 접근 제어를 강제하지 못합니다.

2
문제 2
(2개 선택)

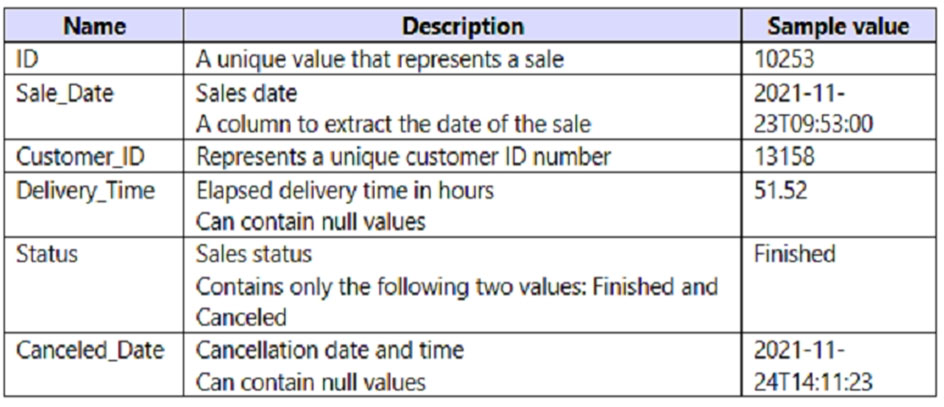
You have a Power BI query named Sales that imports the columns shown in the following table.
diagram

Users only use the date part of the Sales_Date field. Only rows with a Status of Finished are used in analysis. You need to reduce the load times of the query without affecting the analysis. Which two actions achieve this goal? Each correct answer presents a complete solution. NOTE: Each correct selection is worth one point.

Correct. Only rows where Status = Finished are used in analysis, so removing canceled rows does not change report results. This reduces the number of rows imported, transformed, and stored in the model, which improves refresh performance and memory usage. If the source supports query folding, the filter can be pushed down to the source system, making this an especially strong optimization.

Incorrect. Removing Sales_Date would eliminate the sale date entirely, but users still need the date portion for analysis. That would affect reporting, grouping, filtering, and potentially relationships to a calendar table. Because the date is required, the column cannot simply be removed.

Incorrect. Delivery_Time represents elapsed delivery time in hours and includes decimal precision, so converting it to Integer would change the meaning of the data. That could affect calculations, averages, and business interpretation. It is not a safe optimization because it alters analytical results rather than just improving performance.

Correct. Users only need the date part of Sale_Date, not the time portion. Splitting the datetime into separate date and time columns enables retention of the date column and removal of the unnecessary time column, which preserves analysis requirements while reducing unnecessary data content. This also lowers cardinality compared to keeping a full datetime value, which can improve model compression and performance.

Incorrect. Removing Canceled_Date may reduce model size slightly because the column is not needed for finished sales analysis, but by itself it is not the best answer to the explicit requirements given. The question specifically highlights that only the date part of Sale_Date is used, so the more appropriate optimization is to reshape that field rather than focus on Canceled_Date. Therefore E is not one of the two intended complete solutions.

문제 분석

Core concept: This question is about reducing Power BI query load time by eliminating unnecessary rows and unnecessary data content while preserving all information required for analysis. The best optimizations are those that reduce imported row count and avoid loading unused portions of columns. In this scenario, analysts only use rows where Status = Finished and only use the date portion of Sale_Date, so the query should be shaped to match those requirements as closely as possible. Why correct: Filtering out canceled rows directly reduces the number of records loaded and processed, which is one of the most effective ways to improve refresh performance. Separating Sale_Date into date and time allows the model to keep only the date information needed for analysis and discard the unnecessary time portion. Together, these changes reduce data volume without changing report meaning. Key features: Row filtering can often fold back to the source, making it highly efficient. Reducing datetime content to date-only data lowers cardinality and can improve compression. Keeping only required data elements is a standard Power Query and data modeling best practice. Common misconceptions: Removing Canceled_Date alone is helpful but does not fully address the explicit requirement that only the date part of Sale_Date is used. Changing Delivery_Time to integer would alter the data and could affect calculations. Removing Sale_Date entirely would break analysis because the sale date is still required. Exam tips: For PL-300 performance questions, prioritize actions that remove unneeded rows first, then remove or simplify unneeded columns or column content. Be careful to distinguish between optimizations that preserve semantics and those that change the meaning of the data. If a question explicitly says only part of a field is used, expect a transformation that keeps only that needed part.

3
문제 3
(2개 선택)

You have the Power BI model shown in the following exhibit.
diagram

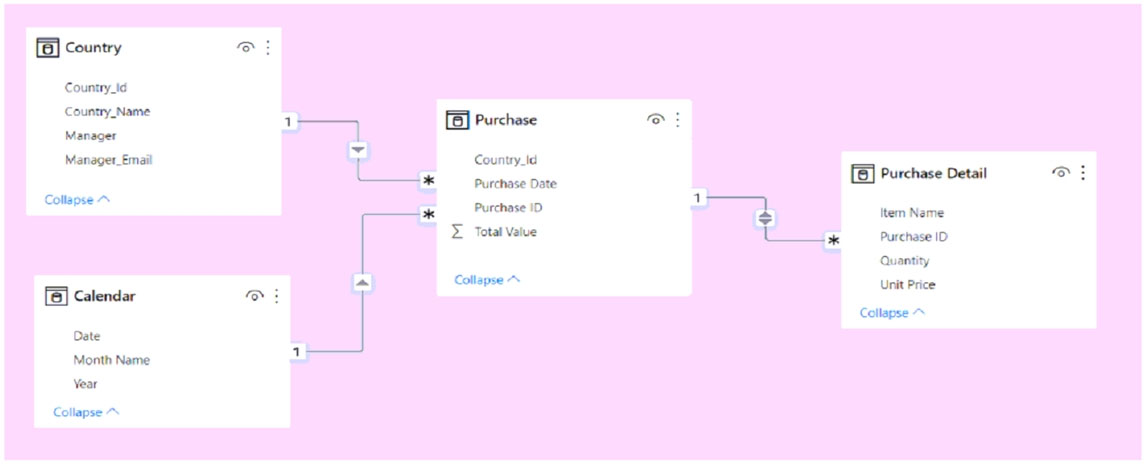
A manager can represent only a single country. You need to use row-level security (RLS) to meet the following requirements: ✑ The managers must only see the data of their respective country. ✑ The number of RLS roles must be minimized. Which two actions should you perform? Each correct answer presents a complete solution. NOTE: Each correct selection is worth one point.

This is the correct way to implement dynamic RLS when the model contains the manager's email address in Country[Manager_Email]. A single role can filter the Country table with a DAX expression such as Country[Manager_Email] = USERNAME() (or USERPRINCIPALNAME() in many service scenarios), which maps the signed-in user to exactly one country. Because each manager represents only one country, this dynamic filter cleanly restricts access without creating multiple static roles. It also satisfies the requirement to minimize the number of RLS roles by using one reusable role for all managers.

USEROBJECTID() returns the Microsoft Entra ID object identifier, not the user's email address. The model stores Manager_Email in the Country table, so there is no matching object ID column to compare against. Using USEROBJECTID() here would not correctly map managers to their country rows unless the data model were redesigned to store object IDs. Therefore, this option does not fit the schema shown in the question.

This action is needed so that the RLS filter applied upstream can propagate correctly through the relationship chain from Country to Purchase and then to Purchase Detail. Although the relationship already connects Purchase to Purchase Detail, enabling Apply security filter in both directions ensures that row-level security is enforced across that relationship for downstream detail rows. Without this setting, users might be filtered correctly at the Purchase level but not have the intended security behavior fully applied to related detail records in all scenarios. This makes it the appropriate configuration choice for securing both fact tables.

Creating one role for each country would work functionally, but it violates the requirement to minimize the number of RLS roles. Since the model already contains a manager-to-country mapping through Manager_Email, dynamic RLS is the more scalable and preferred design. Static per-country roles increase administrative overhead and become harder to maintain as countries or managers change. The exam is specifically steering you toward a single dynamic role instead.

Changing the relationship cross-filter direction to Single does not address the core security requirement. Cross-filter direction controls how report filters propagate during query evaluation, but it is not the same as configuring RLS propagation. In this model, the important setting for security is Apply security filter in both directions on the relevant relationship, not changing the relationship to Single. Therefore, this option does not provide the required RLS behavior.

문제 분석

Core concept: This question tests dynamic row-level security (RLS) in Power BI and how security filters propagate through relationships. The goal is to let each manager see only data for the country they manage while minimizing the number of roles. Why correct: Because the Country table contains Manager_Email, you can create a single dynamic RLS role using USERNAME() to match the signed-in user to the appropriate country row. Since Purchase is related to Country and Purchase Detail is related to Purchase, you must also ensure the security filter propagates correctly to the detail table by enabling Apply security filter in both directions on the Purchase Detail-Purchase relationship. Key features: - Dynamic RLS uses one role instead of one role per country. - USERNAME() is appropriate when the model stores email/user principal name values. - Apply security filter in both directions is specifically for RLS propagation across relationships. - This design reduces administration and scales better than static roles. Common misconceptions: A common mistake is to create many static roles, one per country, even when a user-to-country mapping already exists in the model. Another is to confuse normal cross-filter direction with RLS propagation; changing relationship direction alone does not replace the security filter setting. It is also incorrect to use USEROBJECTID() unless the model stores matching object IDs. Exam tips: When a question asks to minimize the number of RLS roles, look for dynamic RLS with USERNAME() or USERPRINCIPALNAME()-style matching. If security must flow through multiple related tables, check whether Apply security filter in both directions is needed. Always match the identity function to the type of value stored in the model, such as email versus object ID.

4
문제 4

DRAG DROP -

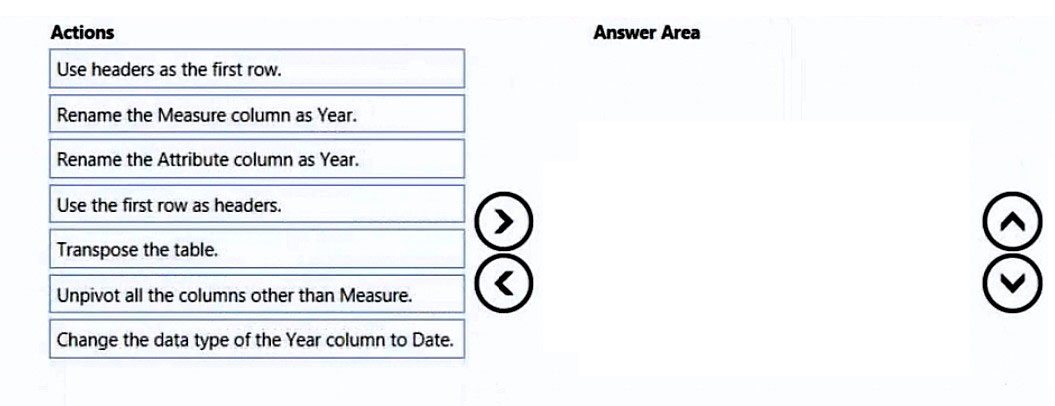
Power Query Editor에서 Microsoft Excel 스프레드시트의 재무 보고서 데이터를 연결했습니다. 연도별 값이 여러 열로 펼쳐져 있으며, Power BI에서 시간 흐름에 따라 분석할 수 있도록 데이터를 변환해야 합니다.

question-image

question-image

파트 1:

재무 보고서 데이터를 시간 흐름 분석에 적합한 형태로 바꾸려면 어떤 순서가 올바른가요?

연도 값이 각각 별도 열로 저장되어 있으므로 테이블을 정규화해야 합니다. 첫 행을 header로 승격하면 Measure와 연도 열 이름이 제대로 잡힙니다. Measure를 제외한 열을 unpivot하면 Year와 값 열이 만들어집니다. Attribute를 Year로 바꾸고 Date 형식으로 지정하면 시간 순서 분석과 time intelligence에 적합해집니다.

5
문제 5

You need to provide a user with the ability to add members to a workspace. The solution must use the principle of least privilege. Which role should you assign to the user?

Viewer is read-only. Viewers can consume reports/dashboards and interact with content they have access to, but they cannot publish, edit, or manage the workspace. Critically, Viewer cannot add or remove users or change workspace roles. This fails the requirement to provide the ability to add members.

Admin can add members, manage permissions, change workspace settings, and perform full administrative actions (including potentially deleting the workspace). While it meets the functional requirement, it violates least privilege because Member can add users without granting full administrative control. Admin should be reserved for workspace owners/governance.

Contributor can create, edit, and publish content in the workspace, but cannot manage workspace access (add/remove members) in the standard Power BI workspace role model. It’s a common choice for collaboration, but it does not satisfy the requirement to add members, so it is insufficient.

Member is the least-privileged role that can add/remove people and assign roles in a workspace. It enables managing access while avoiding the broader control of Admin (workspace settings and full administration). This aligns with the principle of least privilege: grant only what’s needed to add members, not full admin rights.

문제 분석

Core concept: This question tests Power BI workspace roles and governance. In Power BI, workspace access is controlled through roles (Admin, Member, Contributor, Viewer). Each role grants a different set of permissions for managing content and managing access. The principle of least privilege requires granting only the minimum permissions needed to perform the task. Why the answer is correct: To “add members to a workspace,” the user must be able to manage workspace access. In the new workspace experience, both Admin and Member can add/remove people (including assigning roles) for the workspace. Contributor and Viewer cannot manage workspace access. Therefore, the least-privileged role that still allows adding members is Member (not Admin), making option D correct. Key features / best practices: - Member role: Can create, edit, and publish content in the workspace and can manage access (add users/groups) without having full administrative control. - Admin role: Full control, including workspace settings, deleting the workspace, and other governance actions. Use sparingly. - Least privilege: Assign Member only when the user must manage access; otherwise use Contributor (build/publish) or Viewer (read-only). - Prefer adding Azure AD security groups rather than individual users for easier lifecycle management and auditing. Common misconceptions: Many assume “Contributor” implies the ability to invite others because it sounds like a collaboration role. In Power BI, Contributor is focused on content creation/editing, not permission management. Another misconception is that only Admin can add users; however, Member can also manage access, which is why it is the least-privileged correct choice. Exam tips: Memorize the workspace role capability boundary: Viewer = read; Contributor = create/edit content but no access management; Member = includes access management; Admin = full control/settings. When you see “add users/members,” think Member vs Admin, and pick Member for least privilege unless the question explicitly requires workspace settings or full administration.

이동 중에도 모든 문제를 풀고 싶으신가요?

Cloud Pass를 다운로드하세요 — 모의고사, 학습 진도 추적 등을 제공합니다.

6
문제 6

DRAG DROP -

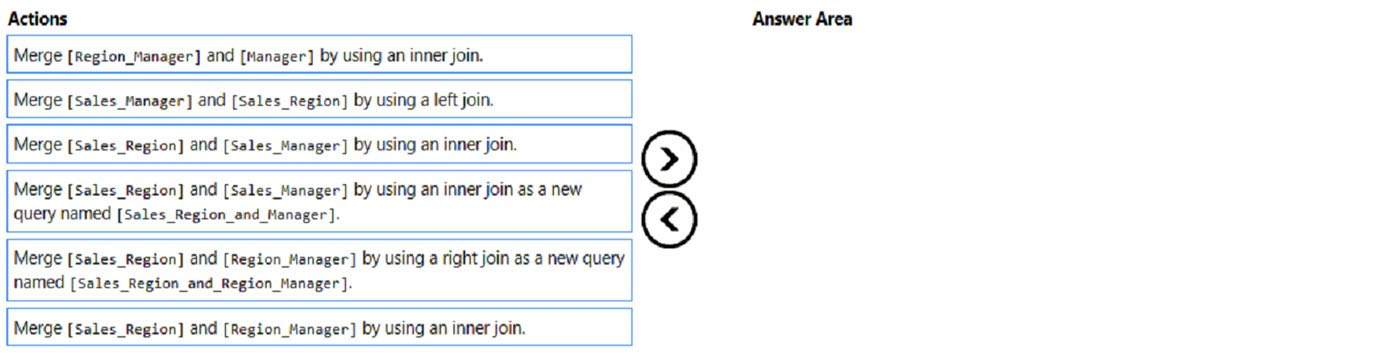
Power BI 데이터 모델이 너무 복잡하다는 피드백을 받았습니다. 여러 region, manager, sales manager 관련 테이블을 merge해 모델을 단순화하면서 필요한 관계는 유지해야 합니다.
question-image

파트 1:

필요한 region-manager 관계를 유지하면서 모델을 단순화하려면 어떤 merge 순서가 올바른가요?

모델을 단순화하려면 region-manager 할당 관계를 기준으로 필요한 manager 및 sales manager 정보를 붙여야 합니다. Sales_Region과 Region_Manager를 right join하면 Region_Manager의 할당 행을 유지할 수 있고, Region_Manager와 Manager의 inner join은 유효한 manager 매칭만 남깁니다. 마지막 left join은 필요한 Sales_Manager 행을 유지하면서 region 정보를 추가합니다. Full outer join이나 무관한 join은 불필요한 행을 남겨 모델을 더 복잡하게 만듭니다.

7
문제 7
(2개 선택)

A user creates a Power BI report named ReportA that uses a custom theme. You create a dashboard named DashboardA. You need to ensure that DashboardA uses the custom theme. The solution must minimize development effort. Which two actions should you perform? Each correct answer presents part of the solution. NOTE: Each correct selection is worth one point.

Publishing ReportA to Power BI is necessary because dashboards exist in the Power BI service and are typically built by pinning visuals from published reports. Without publishing the report, DashboardA cannot practically use content from ReportA in the service. This step is therefore part of enabling the dashboard to reflect the report’s styled visuals. It is also the least-effort path because it reuses the existing report rather than recreating visuals elsewhere.

Saving the current theme from ReportA exports the report theme definition for reuse with reports, not dashboards. Report themes in Power BI Desktop control report visual formatting and are not the same as dashboard themes in the Power BI service. Exporting the theme does not by itself make DashboardA use that theme. Therefore, this action does not directly satisfy the requirement.

Publishing ReportA to the Microsoft Power BI Community theme gallery is unrelated to applying a theme to an internal dashboard. The gallery is for sharing themes publicly with other users, not for configuring a dashboard in your tenant. It adds unnecessary effort and does not help DashboardA adopt the theme. This option is clearly out of scope for the requirement.

From DashboardA, creating a custom theme is the supported way to apply dashboard-level theming in the Power BI service. Dashboards have their own theme settings and do not directly consume a report theme exported from Desktop. Although this requires a dashboard action, it is still the correct service-based method for ensuring the dashboard uses a theme. In the context of the available options, this is the valid dashboard theming step.

DashboardA does not support applying the report’s custom theme simply by uploading a JSON theme exported from ReportA in the manner implied here. Dashboard theming is handled through dashboard customization in the Power BI service rather than by reusing a report theme file from Desktop. As a result, this option is technically misleading for dashboard theming. It is not the correct action to ensure DashboardA uses the custom theme.

문제 분석

Core concept: Power BI report themes and dashboard themes are separate capabilities. A custom theme applied to a report affects report visuals, but dashboards in the Power BI service do not automatically inherit that report theme unless visuals are pinned from the published report and the dashboard itself is themed in the service. Why correct: You must first publish ReportA so its visuals can be pinned or used in the service, and then configure the dashboard theme from DashboardA. Key features: reports are authored in Power BI Desktop and published to the service; dashboards are service-only artifacts with their own theming controls; dashboard themes are not applied by exporting a report theme JSON and uploading it to a dashboard. Common misconceptions: many candidates assume report theme JSON files can be reused directly for dashboards, but dashboard theming is managed separately in the service. Exam tips: when a question asks about dashboards, focus on Power BI service capabilities rather than Desktop-only report theme actions.

8
문제 8

HOTSPOT - You publish the dataset to powerbi.com. For each of the following statements, select Yes if the statement is true. Otherwise, select No. NOTE: Each correct selection is worth one point. Hot Area:

파트 1:

You need an on-premises data gateway to refresh the dataset.

Answer: No. An on-premises data gateway is only required when the Power BI service needs to access a data source that is on-premises or otherwise not reachable from the Power BI service over the public internet. In this scenario (as implied by typical PL-300 hotspot patterns when publishing to powerbi.com), the dataset connects to a cloud-accessible source, so the service can authenticate and refresh without a gateway. Why “Yes” would be wrong: If the data source were SQL Server on-premises, a local file path, or a private network resource, then a gateway would be mandatory for refresh (and for DirectQuery to on-prem sources). But for cloud sources (for example, Azure SQL Database with public endpoint, SharePoint Online, or SaaS), Power BI can connect directly. Exam tip: Always map the source location and network accessibility. Gateway requirement is about network reachability from the Power BI service, not about whether the dataset is published.

파트 2:

You need to configure a scheduled refresh of the dataset.

Answer: Yes. After publishing an Import-mode dataset to the Power BI service, you typically must configure scheduled refresh if you want the data to stay current automatically. Publishing uploads the model and the imported data snapshot, but it does not automatically set up a refresh cadence. In the service, you configure dataset credentials and then define a refresh schedule (daily/weekly, time slots, time zone, failure notifications, etc.). Why “No” would be wrong: Without scheduled refresh, the dataset will only update when you manually refresh in the service or republish from Power BI Desktop. That does not meet most operational requirements for ongoing reporting. Exam tip: Scheduled refresh is primarily an Import dataset concept. DirectQuery/live connections don’t refresh on a schedule in the same way (they query the source at view time), though they may still require credential configuration and potentially a gateway depending on the source.

파트 3:

You can use Basic authentication on the dataset to connect to the data.

Answer: No. Basic authentication is not universally supported in Power BI service for dataset connections and is commonly not the correct choice for modern organizational data sources. Many connectors and enterprise data sources require OAuth2 or Microsoft Entra ID (Azure AD) authentication, and organizations frequently disable Basic auth due to security best practices (credential exposure risk, lack of MFA/conditional access, and weaker governance). Why “Yes” would be wrong: “Basic” might be available for a limited set of sources (for example, some generic web endpoints), but unless the scenario explicitly states a connector/source that supports Basic and that it is permitted, you should not assume it can be used. PL-300 questions typically expect you to choose organizational authentication methods (OAuth/Entra ID) for cloud services. Exam tip: Align authentication with Zero Trust and the Azure Well-Architected Framework security pillar—prefer modern identity-based auth over username/password where possible.

9
문제 9

Note: This question is part of a series of questions that present the same scenario. Each question in the series contains a unique solution that might meet the stated goals. Some question sets might have more than one correct solution, while others might not have a correct solution. After you answer a question in this section, you will NOT be able to return to it. As a result, these questions will not appear in the review screen. You have a Power BI report that imports a date table and a sales table from an Azure SQL database data source. The sales table has the following date foreign keys: ✑ Due Date ✑ Order Date ✑ Delivery Date You need to support the analysis of sales over time based on all the date foreign keys. Solution: For each date foreign key, you add inactive relationships between the sales table and the date table. Does this meet the goal?

Yes is correct because a sales table with multiple date foreign keys commonly requires multiple relationships to a single Date table, and only one of those relationships can be active at a time. Creating inactive relationships for the additional date columns is the standard Power BI modeling approach for supporting alternate date analysis paths. Those inactive relationships can then be used in measures with USERELATIONSHIP so visuals can evaluate sales by Due Date, Order Date, or Delivery Date as needed. This satisfies the goal of supporting analysis over time based on all the date foreign keys.

No is incorrect because adding inactive relationships is exactly how Power BI models multiple date roles against one Date dimension when only one active relationship is allowed. Without those inactive relationships, there would be no built-in relationship path available for DAX to activate for the alternate date columns. While additional measures may be needed to expose each date perspective in reports, the proposed solution itself is a valid and necessary step that meets the stated goal. Therefore rejecting the solution would ignore a standard and supported modeling pattern in Power BI.

문제 분석

Core concept: A fact table can contain multiple date columns, but Power BI allows only one active relationship between two tables at a time. To support analysis by Due Date, Order Date, and Delivery Date against a single Date table, the model commonly uses one active relationship and additional inactive relationships, with measures activating the needed relationship by using USERELATIONSHIP. Why correct: Adding inactive relationships for each date foreign key is the standard way to enable alternate date analysis paths in a star schema. Key features: one active relationship at a time, inactive relationships available for DAX activation, and a shared conformed Date table for consistent time intelligence. Common misconceptions: some assume all relationships must be active, but Power BI does not permit multiple active relationships between the same two tables; others think inactive relationships are useless, but they are specifically intended for scenarios like multiple date roles. Exam tips: when a fact table has several date columns tied to one Date dimension, think role-playing date dimension patterns or inactive relationships plus USERELATIONSHIP in measures.

10
문제 10

HOTSPOT - You need to create a relationship in the dataset for RLS. What should you do? To answer, select the appropriate options in the answer area. NOTE: Each correct selection is worth one point. Hot Area:

파트 1:

Create a ______ relationship between the Sales Employees table and the ______ table.

To support RLS, the Sales Employees table should act like a dimension (or security dimension) that filters downstream tables. In a typical model, each employee appears once in Sales Employees (unique EmployeeID/UPN), while the related transactional table contains many rows per employee. That pattern is a one-to-many relationship: Sales Employees on the “one” side and the related table on the “many” side. Why not the others: - One-to-one is uncommon here because a fact/transaction table (like Orders) will have multiple rows per employee. - Many-to-one is just the inverse description; in Power BI you define cardinality, and the correct conceptual direction is dimension (one) to fact (many). - Many-to-many is generally avoided for RLS because it can introduce ambiguous filter propagation and can lead to incorrect or overly permissive results unless additional measures/bridge tables and careful direction settings are used.

파트 2:

Create a ______ relationship between the Sales Employees table and the ______ table.

The relationship for RLS should connect Sales Employees to the table that contains the employee key used to restrict sales transactions. Among the options, the Orders table is the most appropriate target because it is the core fact table that records sales transactions and typically includes a SalespersonID/EmployeeID column. By relating Sales Employees (dimension/security table) to Orders (fact table), an RLS role that filters Sales Employees (often using USERPRINCIPALNAME() to match the logged-in user) will propagate to Orders and restrict what rows are visible. Why not the others: - Suppliers table is usually unrelated to sales employee security and would not restrict sales transactions correctly. - Order Details is typically a child fact table related to Orders; securing at Orders is cleaner and then flows to Order Details through the Orders relationship. - Customer Details worksheet sounds like a source artifact rather than the correct model fact table for enforcing sales-employee-based RLS.

다른 모의고사

Practice Test #1

50 문제·100분·합격 700/1000

Practice Test #2

50 문제·100분·합격 700/1000

Practice Test #3

50 문제·100분·합격 700/1000

Practice Test #5

50 문제·100분·합격 700/1000
← 모든 PL-300: Microsoft Power BI Data Analyst 문제 보기

지금 학습 시작하기

Cloud Pass를 다운로드하고 모든 PL-300: Microsoft Power BI Data Analyst 기출 문제를 풀어보세요.

Get it on Google PlayDownload on the App Store
Cloud PassCloud Pass

IT 자격증 문제풀이 앱

Get it on Google PlayDownload on the App Store

자격증

AWSGCPMicrosoftCiscoCompTIADatabricks

법률

FAQ개인정보 처리방침서비스 약관

회사

문의하기계정 삭제

© Copyright 2026 Cloud Pass, All rights reserved.

이동 중에도 모든 문제를 풀고 싶으신가요?

앱 받기

Cloud Pass를 다운로드하세요 — 모의고사, 학습 진도 추적 등을 제공합니다.