
Practice Test #3
50개 문제와 100분 시간 제한으로 실제 시험을 시뮬레이션하세요. AI 검증 답안과 상세 해설로 학습하세요.
AI 기반
3중 AI 검증 답안 및 해설
GPT Pro, Claude Opus, Gemini Pro가 답안과 해설을 교차 검증합니다. 선택지별 근거부터 요구사항 분해와 정답 아키텍처까지 확인하세요.
실전형 문제
You are creating a report in Power BI Desktop. You load a data extract that includes a free text field named coll. You need to analyze the frequency distribution of the string lengths in col1. The solution must not affect the size of the model. What should you do?
Note: This question is part of a series of questions that present the same scenario. Each question in the series contains a unique solution that might meet the stated goals. Some question sets might have more than one correct solution, while others might not have a correct solution. After you answer a question in this section, you will NOT be able to return to it. As a result, these questions will not appear in the review screen. You are modeling data by using Microsoft Power BI. Part of the data model is a large Microsoft SQL Server table named Order that has more than 100 million records. During the development process, you need to import a sample of the data from the Order table. Solution: You write a DAX expression that uses the FILTER function. Does this meet the goal?
You have a report that contains four pages. Each page contains slicers for the same four fields. Users report that when they select values in a slicer on one page, the selections are not persisted on other pages. You need to recommend a solution to ensure that users can select a value once to filter the results on all the pages. What are two possible recommendations to achieve this goal? Each correct answer presents a complete solution. NOTE: Each correct selection is worth one point.
DRAG DROP -
Microsoft Excel 원본의 수익 데이터를 Power Query에서 미리 보고 있습니다. 보고서에서 사용하기 쉽도록 부서, 제품, 연도, 수익이 각각 열로 표현되는 정규화된 테이블로 변환해야 합니다.
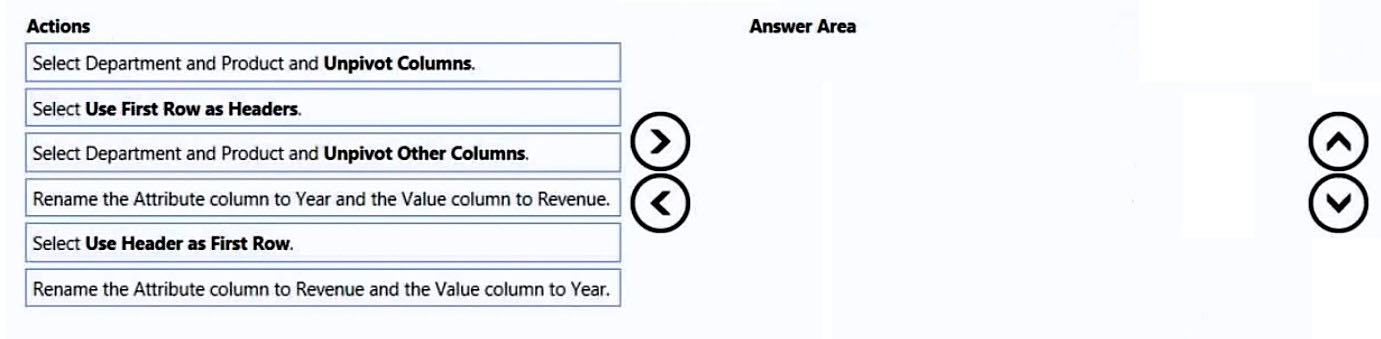
Department, Product, Year, Revenue 열을 가진 긴 형태의 수익 테이블을 만들려면 어떤 Power Query 변환 순서가 올바른가요?
DRAG DROP -
Power BI Desktop에서 Sales 테이블과 Transaction Size 테이블을 사용하는 모델을 수정하고 있습니다. Sales 금액이 어느 거래 크기 범위에 속하는지 계산 열로 분류해야 합니다.
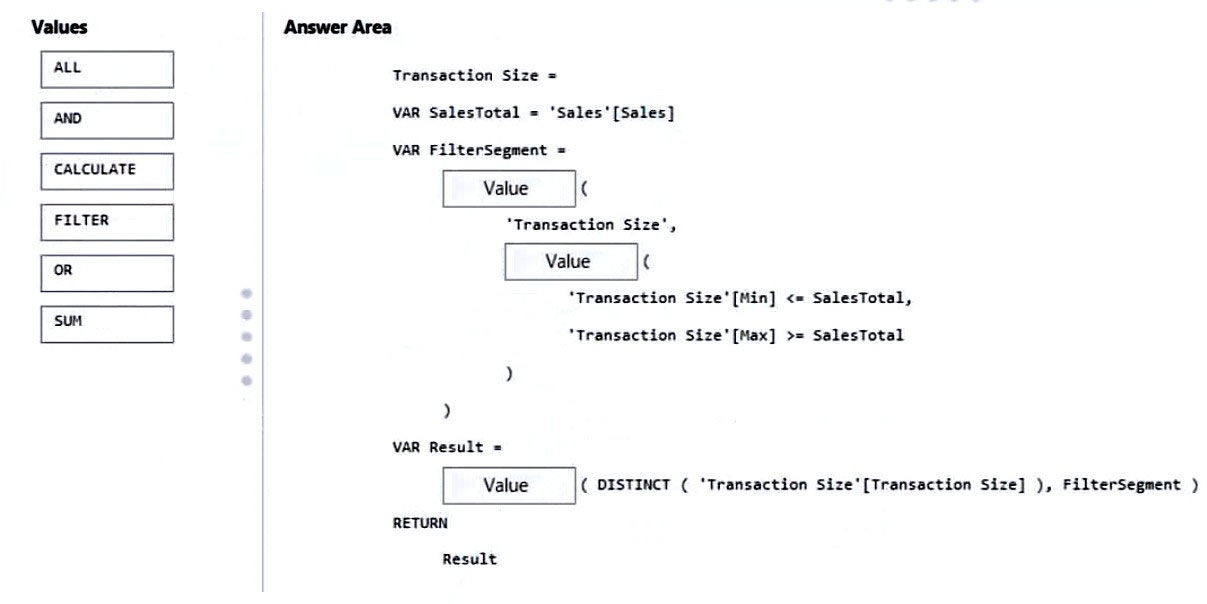
계산 열 DAX 식을 완성하려면 어떤 함수 조합이 올바른가요?
합격 루틴을 앱에서 이어가세요
실전 모의고사, AI 해설, 약점 회독과 학습 분석을 모두 제공합니다.
HOTSPOT - You have two CSV files named Products and Categories. The Products file contains the following columns: ✑ ProductID ✑ ProductName ✑ SupplierID ✑ CategoryID The Categories file contains the following columns: ✑ CategoryID ✑ CategoryName ✑ CategoryDescription From Power BI Desktop, you import the files into Power Query Editor. You need to create a Power BI dataset that will contain a single table named Product. The Product will table includes the following columns: ✑ ProductID ✑ ProductName ✑ SupplierID ✑ CategoryID ✑ CategoryName ✑ CategoryDescription How should you combine the queries, and what should you do on the Categories query? To answer, select the appropriate options in the answer area. NOTE: Each correct selection is worth one point. Hot Area:
Combine the queries by performing a: ______
On the Categories query: ______
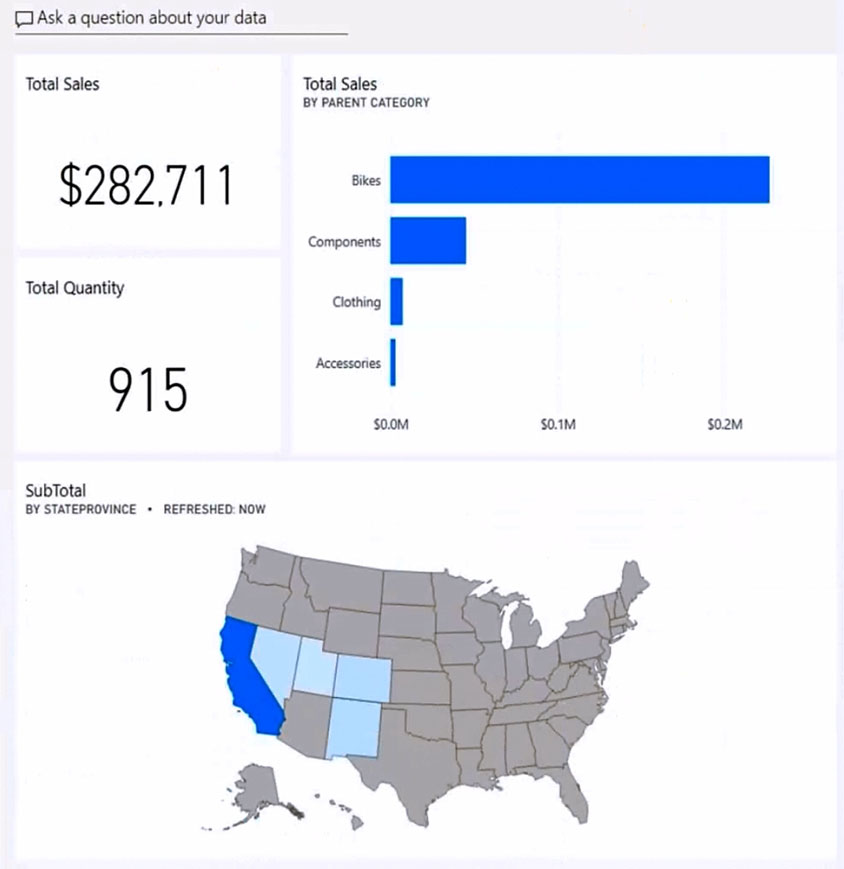
HOTSPOT - You have the Power BI dashboard shown in the Dashboard exhibit. (Click the Dashboard tab.)
You need to ensure that when users view the dashboard on a mobile device, the dashboard appears as shown in the Mobile exhibit. (Click the Mobile tab.)
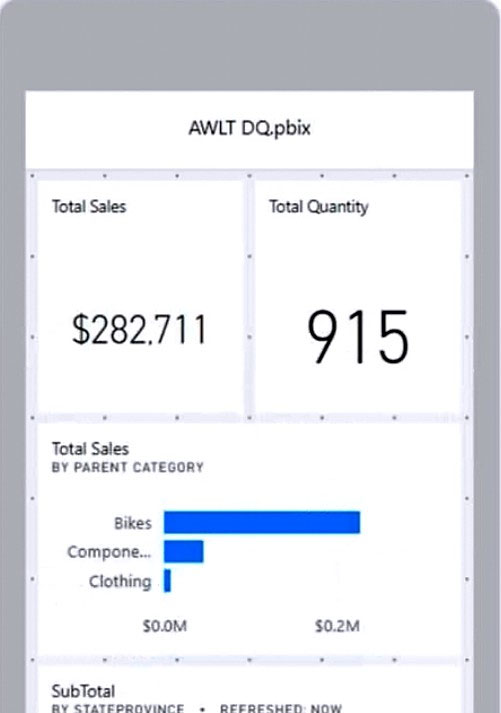
What should you do? To answer, select the appropriate options in the answer area. NOTE: Each correct selection is worth one point. Hot Area:
Update the layout in the: Dashboard mobile layout
Update the layout in the: Dashboard web layout
Update the layout in the: Report mobile layout
Resize and move: The SubTotal map tile
Resize and move: The Total Sales and Total Quantity tiles
Resize and move: The Total Sales by Parent Category tile
You have a report that contains three pages. One of the pages contains a KPI visualization. You need to filter all the visualizations in the report except for the KPI visualization. Which two actions should you perform? Each correct answer presents part of the solution. NOTE: Each correct selection is worth one point.
A business intelligence (BI) developer creates a dataflow in Power BI that uses DirectQuery to access tables from an on-premises Microsoft SQL server. The Enhanced Dataflows Compute Engine is turned on for the dataflow. You need to use the dataflow in a report. The solution must meet the following requirements: ✑ Minimize online processing operations. ✑ Minimize calculation times and render times for visuals. ✑ Include data from the current year, up to and including the previous day. What should you do?
You have a Power BI tenant. You have reports that use financial datasets and are exported as PDF files. You need to ensure that the reports are encrypted. What should you implement?

지금 학습 시작하기
Cloud Pass를 다운로드하고 PL-300: Microsoft Power BI Data Analyst 자격증 학습을 이어가세요.